
AB Test Statistical Significance on Shopify: Spot the Mirage
A test that shows a 300% lift feels like the best news you have gotten all quarter. Sometimes it is. Sometimes it is forty visitors and a coin flip wearing a lab coat. The gap between those two stories is exactly what ab test statistical significance on Shopify is supposed to catch, and most brands never actually check it before they call a winner and roll it out.
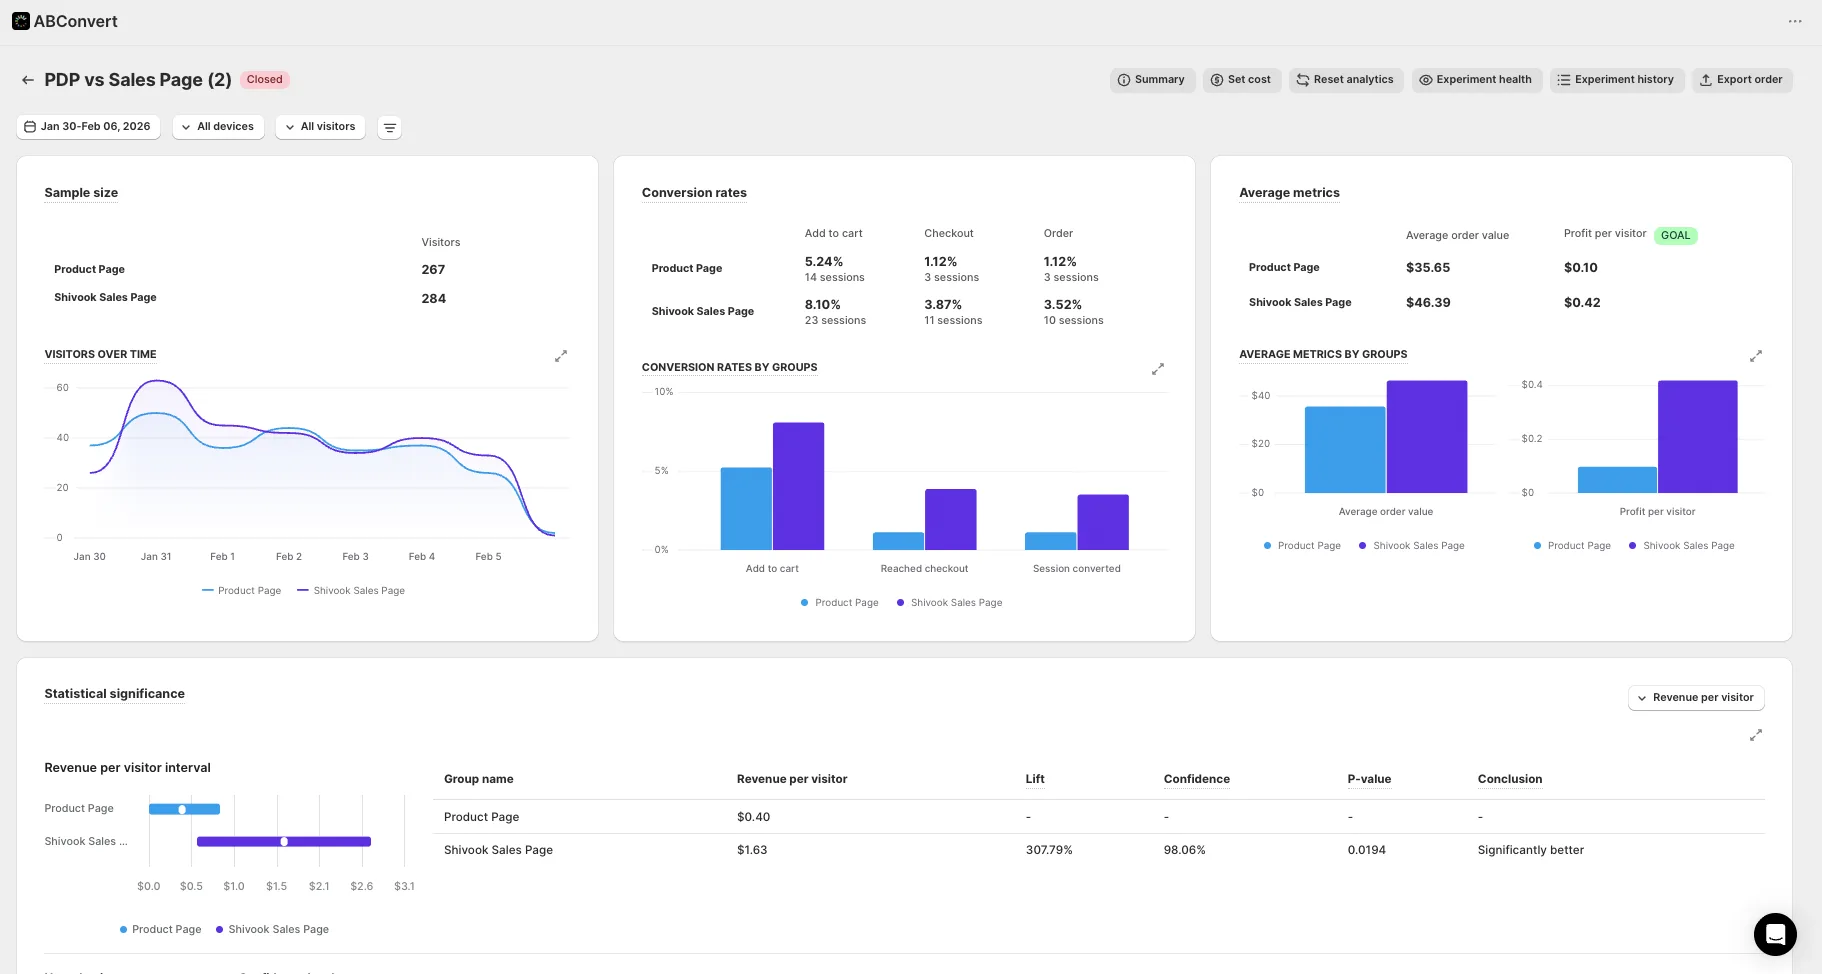
We have run fifteen measured page rebuild tests across brands we have worked with. Two of them produced triple digit lifts. Two of them produced double digit lifts on tens of thousands of sessions. Both pairs are real. They do not mean the same thing, and reading them as if they do is how a brand ends up rolling out a page that quietly loses money at scale.
What a big percentage actually tells you
A percentage lift is a ratio of two averages. It says nothing, by itself, about how much data sits under either average. A 300% lift built on a few dozen orders can flip entirely with the next ten orders. A 13% lift built on tens of thousands of sessions is a different kind of claim, because the noise has had far less room to move it.
This is not a reason to distrust every large number. Two of our own results, Prime Natural at +307% revenue per visitor and Snuff Cup at +310% revenue per visitor, are both real, measured, honestly reported numbers. We flag them internally as small sample, big result, because that is what they are. The direction is real. The exact magnitude is not something we would bet the brand’s whole traffic on without more data.
How ab test statistical significance works on Shopify
A testing platform like VWO or ABConvert is not just counting orders. It is asking how likely the observed gap is to be real noise, given the sample size on both sides. That is what a confidence percentage or a probability to win is reporting. 95% confidence is the common bar. Below that, you are looking at a trend, not a result, no matter how dramatic the headline number looks.
Sample size and confidence move together. A brand doing a few hundred sessions a week will need to run a test for a meaningful stretch before the platform can say much with any certainty. A brand doing tens of thousands of sessions a week can reach a real answer inside two weeks, which is exactly what happened with DuraDry, where an offer page beat their product page by 45% revenue per visitor on Google Ads traffic over two weeks, read straight from VWO.
What a real large sample win looks like
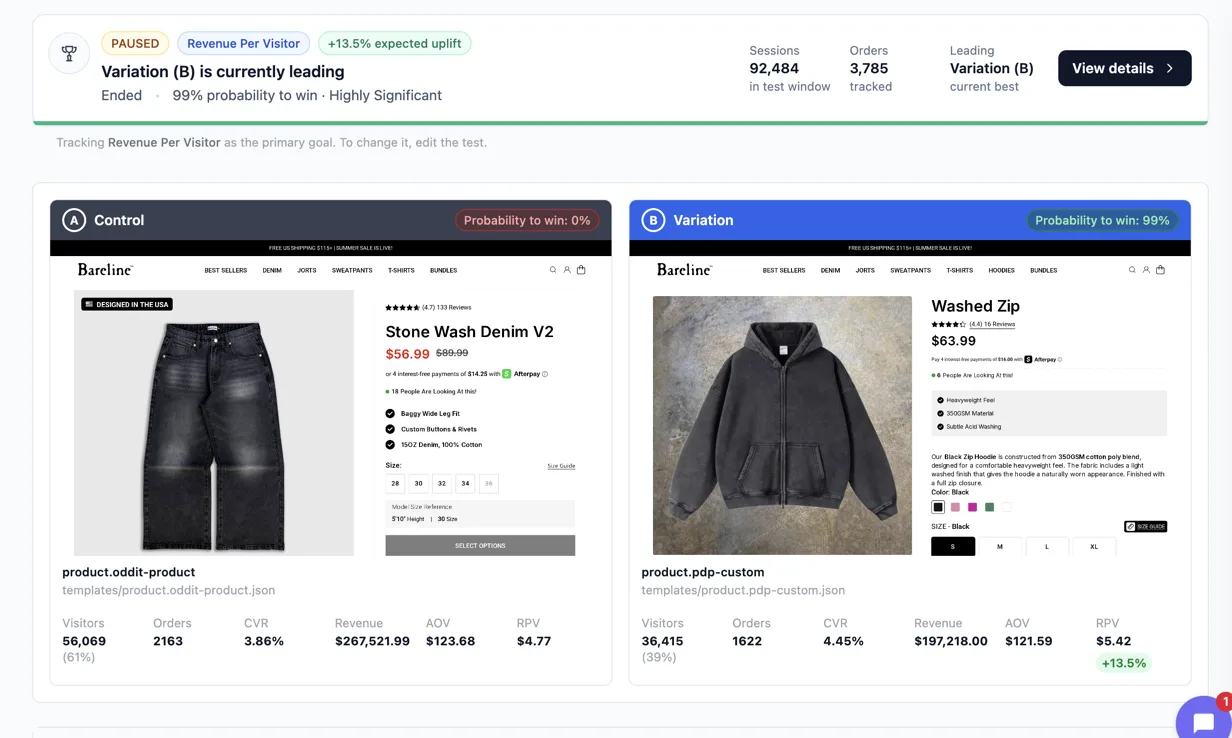
Bareline is the clean contrast case. Testing our page template against their own template, on sitewide product traffic, Eraya reported 99% probability to win across 92,484 sessions, landing on a 13.5% lift in revenue per visitor. That is a smaller headline number than Prime Natural’s, and it is the more trustworthy one, because the sample behind it is large enough that the platform’s confidence read means something.
Particle for Men sits in the same category. Its offer page beat their product page by 21.4% revenue per visitor at 99.5% confidence across 12,893 visitors, and that page is still live two years later. A result that holds up that long was never a mirage to begin with.
A number you can act on is the one that survives more traffic, not the one that impressed you first.
How to tell the two apart before you declare a winner
Before you roll a test out to 100% of traffic, check three things.
- What does the platform’s confidence or probability to win actually read, not just the headline percentage.
- How many sessions or visitors is that number built on. A lift with no sample size attached is not a claim, it is a rumor.
- Has the result held as more traffic came in, or was it read at the first moment it looked good.
A winner that has been running at full traffic for a long stretch will often read lower later than it did the day the test finished. That is normal decay, not a lie about the original number, and it is exactly why every result we publish carries its methodology alongside the figure rather than the number alone. You can see the full set, methodology included, on our results page. If you want to know what we guarantee before you run anything at all, that is laid out plainly on the guarantee page.
See it on your own page.
We rebuild your highest-leverage page and prove the lift on your own live traffic. A 10% lift in conversion rate, or your money back.
Book a call