
Why CRO Results Vary by Product Page
Two Shopify brands got the same rebuild. Same offer page structure, same proof logic, same method, both tested against their own product page on Meta traffic and read in ABConvert. One lifted revenue per visitor by **10%**. The other lifted it by **307%**. If you are trying to understand why CRO results vary by product page before anyone even reads the copy, start here: the ceiling on a test is mostly set before the page is written.
The leverage order decides more than the writing does
A rebuild is not one lever, it is four, stacked in order of how much each one actually moves the number:
- What the visitor lands on. An ad for one product sending traffic to a home page or a broad collection makes the shopper do the work of finding what they came for. Most will not bother.
- What kind of page it is. A product page describes a product. An offer page argues for buying it now. Different jobs, different conversion rates.
- How the page itself is built. Real, and where most brands start, but a smaller lever than either of the above.
- Single element changes. Button color, badge wording. At this scale, mostly noise.
Look at where the landing point was weakest. Eiyan Lens tested an offer page against their own home page and saw revenue per visitor move +52% on Google Ads traffic, read in ABConvert. Free the Roots tested an offer page against a collection page and saw +33% on Meta traffic, also in ABConvert. Both of those baselines were already losing the visitor before the pitch even started. A home page and a collection page ask a shopper who already clicked an ad to go find the thing they wanted a second time.
Why CRO results vary by product page even with the identical approach
Here is the part that trips people up. Most of our results are not that first lever at all, they are an offer page against the brand’s own product page, the same comparison, run the same way. And the spread between them is enormous.
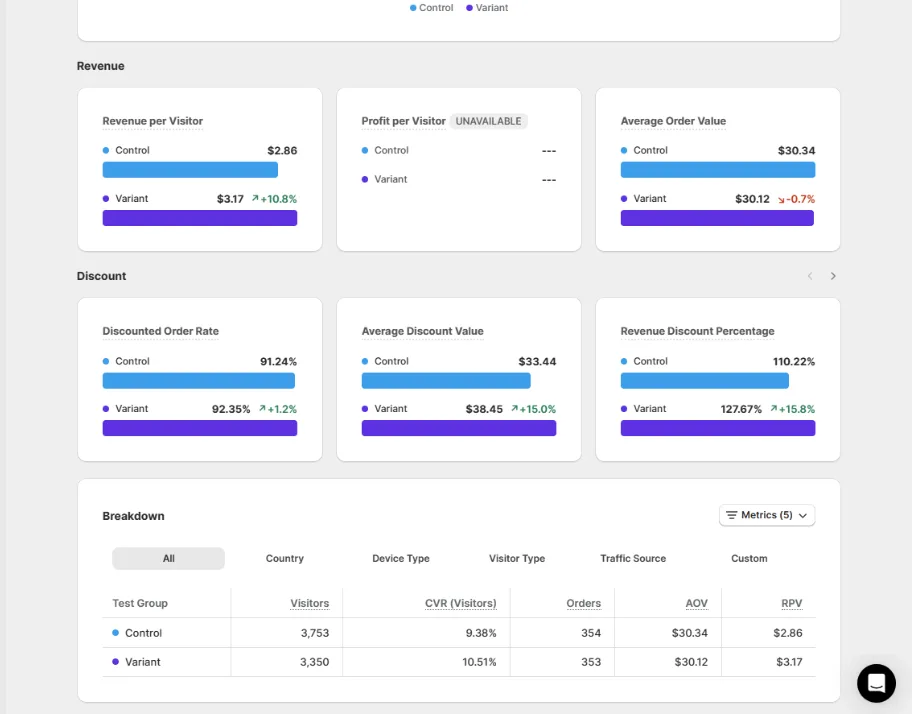
Pure Path Shop, a pet grooming brand, ran an offer page against their product page on Meta traffic and saw revenue per visitor move +10%.
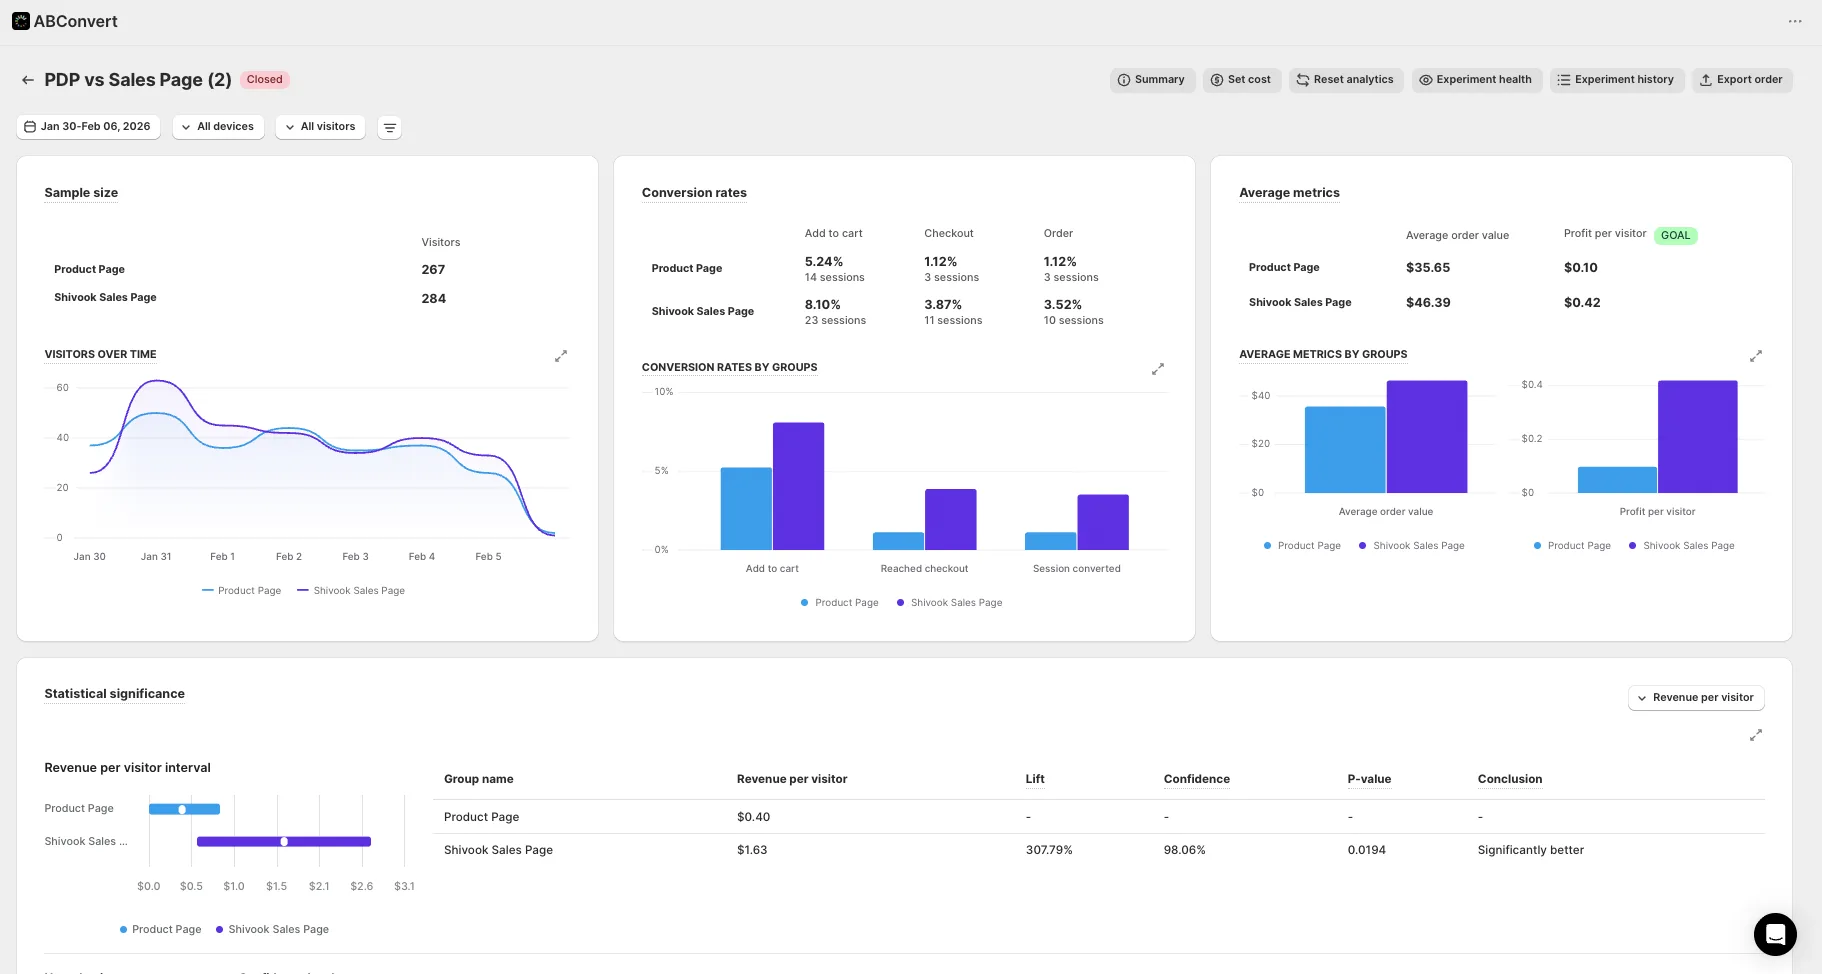
Prime Natural, an essential oils brand, ran the identical comparison, offer page against product page, Meta traffic, ABConvert, and saw revenue per visitor move +307%.
Same page type on both sides of the comparison, same traffic source, same testing platform. The only thing that changed was what the product page had to work with. A thin product page with little proof and a flat presentation leaves a lot of room to improve on. A product page that already carries some real proof, a believable price, and a reasonably clear pitch has less air underneath it, so the rebuild still wins, it just does not win by as much.
One honest caveat belongs here. Prime Natural’s result ran on a small sample. A 307% lift on a small sample is a real, measured result read straight from the brand’s own testing platform, never ad platform reported revenue, but it is a strong direction more than a settled number. Read it that way.
The rebuild did not get smarter between a 10% win and a 300% win. The page it was rebuilding got weaker.
Proof is the lever most pages leave on the table
What actually produces a spread like that, test after test, is proof availability, not layout. A page can only argue as hard as the brand can back it up. Before writing a line of copy, the real work is cataloguing what the brand genuinely has: a founder story, a credible ambassador, a real clinical result, third party testing, verified reviews, volume. Whatever is true gets layered in, strongest first, right at the top of the page. A brand with thin proof should get a shorter page, not a padded one.
That is also why the spread shows up on near identical tests. Legendary Car Care moved +32% on an offer page against their product page, Meta traffic, ABConvert. DuraDry moved +45% on the same comparison, Google Ads traffic, over two weeks in VWO. Dreem Nutrition moved +25%, Sonic Brush moved +24% with our product page against theirs, and Bareline moved +13.5% on a product page template against a product page template, read with 99% probability to win across 92,484 sessions in Eraya. Every one of those is a real lift. None of them is the same size, because none of those brands walked in with the same proof, the same price story, or the same starting page.
Why we check revenue per visitor, not conversion rate alone
Conversion rate is the number most store owners watch, and it is the number our guarantee is built on. But conversion rate on its own can be moved by pushing a cheaper product forward or running a discount, and the test looks like a win while the business earns less per order. So every result we publish is read in revenue per visitor, total revenue divided by total visitors, because that number holds conversion rate and order value at once. If a page lifts conversion rate and drops revenue per visitor, it lost, no matter what the headline number says.
What this means before you test anything
If you are trying to predict what a rebuild will do for your own store, do not start with the copy. Start with three questions, in this order: where is the traffic actually landing, what kind of page is it landing on, and what can this brand genuinely prove. Those three answers set the ceiling. The writing fills in underneath it.
The guarantee behind our own offer, a 10% lift in conversion rate in a controlled test or your money back, is set at the floor end of that range on purpose. See the full case list on /results and what the guarantee actually covers on /guarantee.
See it on your own page.
We rebuild your highest-leverage page and prove the lift on your own live traffic. A 10% lift in conversion rate, or your money back.
Book a call