
Shopify Subscription Offer Table: The Decoy That Works
A shopify subscription offer table conversion rate problem almost never starts with the subscribe button. It starts with the fact that most stores sell the subscription and the one time purchase as two equal, unranked options, and asking a visitor to compare two unranked prices is asking them to think, and a visitor who has to think usually leaves.
The fix is not a better subscribe button. It is a three tier table with a decoy built into it, and it is one of the highest leverage changes you can make on a consumable or subscription product page.
Why a flat subscribe or buy once choice loses conversion rate
When a page shows subscription and one time purchase as two plain, same weight options, the visitor has to do real work to figure out which is smarter, and most people resolve that friction by picking neither and closing the tab. A table with no hierarchy asks for a decision. A table with hierarchy makes the decision for them and lets them confirm it.
This is the gap between a product page and an offer page. A product page describes what the thing is. An offer page argues for buying it now, and argument requires structure, not just information sitting next to a price.
The three tier structure, built around a decoy
The table that works has three options, shown in this visual order:
- The best value tier, badged as such, usually the longest subscription commitment
- The middle tier, badged most popular, the one most visitors should land on
- The one time purchase, shown small, unbadged, pushed to the side
The one time option is not there to be bought. It exists so the other two look like the obviously smart choice by comparison. Remove it and the subscription options have nothing to look good against. This is the whole mechanism, and it is why calling the one time tier a decoy is accurate rather than cynical: its job is comparison, not conversion.
Get the badges wrong and the table stops working. A badge on the wrong tier, or two tiers that look equally weighted, puts the visitor back to doing the comparison themselves, which is the exact friction the table was built to remove.
Always show unit economics
Next to every tier, show price per serving or price per day, not just the subscription total. A monthly price looks large on its own. Divided by thirty days it usually looks small, and large numbers shrink when you divide them, which is the entire reason this works. Skipping unit economics on a subscription offer table is leaving one of the cheapest conversion rate levers on the table, literally unused, on a page that already has the data to do it.
Anchor with a real struck through price
The discount is the story on most of these tables, and the story only works if the struck through reference price is real. An invented inflation is the fastest way to lose trust on a page a visitor is actively comparing against competitors in another tab. Pair the anchor with a value stack where it is true: itemize what ships free with the subscription, price each item, and total it against what the one time buyer pays for nothing extra. A free add on that outvalues the discount beats a deeper discount, because it changes the comparison from price against price to total value against price.
The one time option exists to make the other two look obviously smarter, not to be chosen.
Read the result as revenue per visitor, not just conversion rate
A tiered offer table can lift conversion rate by making the cheapest tier too easy to pick, and if that happens your conversion rate chart goes up while your revenue per order goes down. The guard against that is reading every test in revenue per visitor, which holds conversion rate and average order value together in one number. A page that wins on conversion rate and loses on revenue per visitor has not actually won.
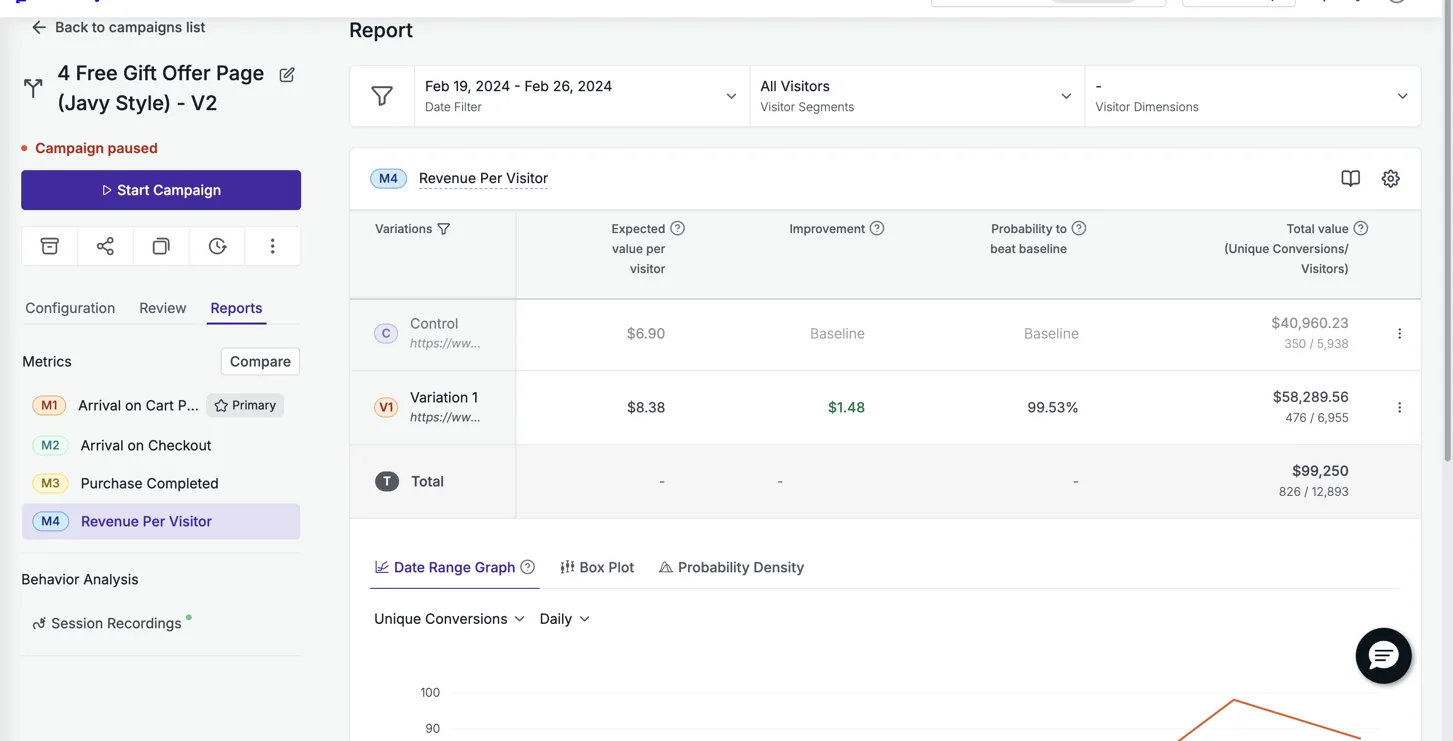
This is exactly the discipline behind our own results. Particle for Men ran an offer page against their product page on 12,893 visitors in VWO and came back +21.4% revenue per visitor at 99.5% confidence, a result that has held up for two years live. DuraDry tested an offer page against their product page on Google Ads traffic in VWO over two weeks and landed +45% revenue per visitor.
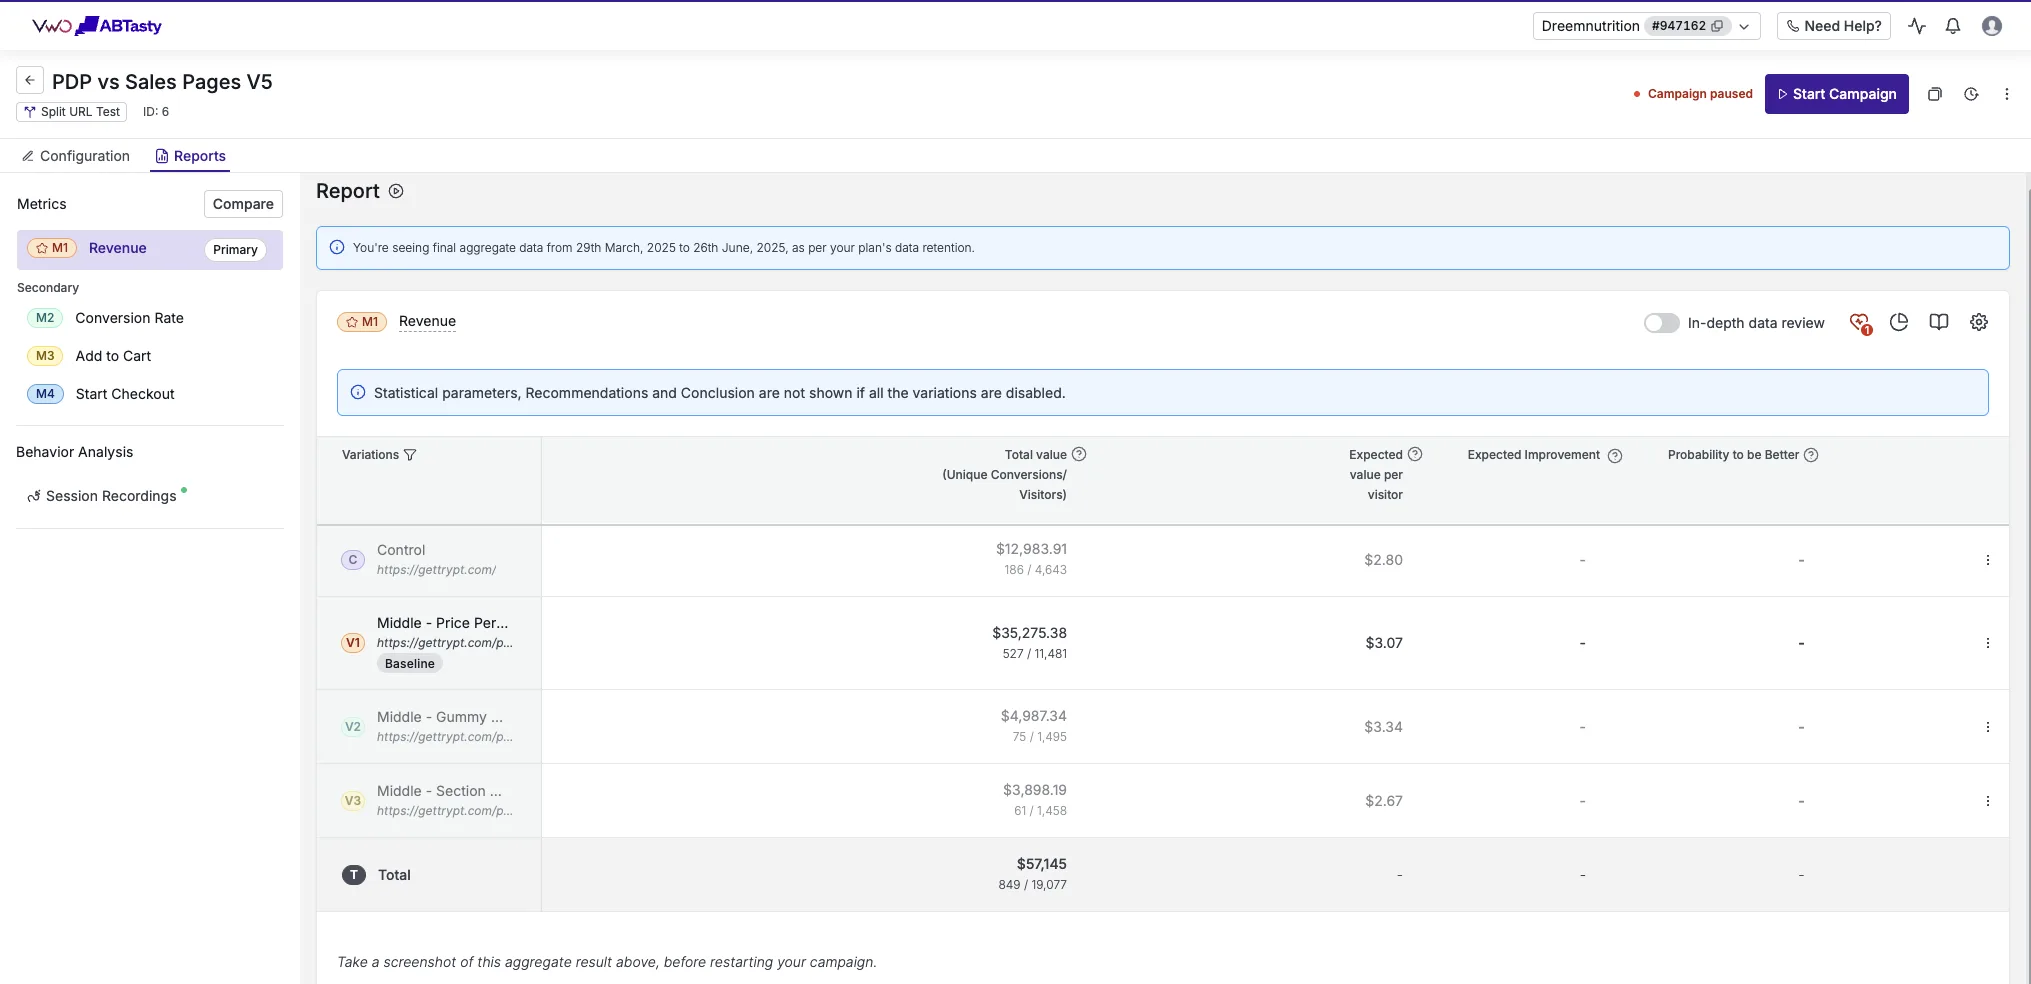
Dreem Nutrition ran the same shape of test, offer page against product page, on their own traffic in VWO, and came back +19% revenue per visitor with full metric tracking in place, meaning the lift showed up in conversion rate and held in revenue per visitor at the same time, which is the only version of a win worth keeping.
Build it, test it, and read it against your own traffic
A tiered table is not a one time write and forget component. The offer table, the badge wording, and the anchor price are the easiest parts of the page to swap in a test, which makes them the right place to start testing before you touch anything else on the page. Build the table so the tiers, the badges, and the anchor can each be changed independently, then test on your own live traffic and read the result in revenue per visitor before calling it a win.
Every number in this post came from a controlled test, split on the brand’s own live traffic, read from an A/B testing platform rather than from ad platform reporting. You can see the full set of these on /results, and the guarantee we build to, a 10% lift in conversion rate in a controlled test or your money back, is laid out on /guarantee.
See it on your own page.
We rebuild your highest-leverage page and prove the lift on your own live traffic. A 10% lift in conversion rate, or your money back.
Book a call