
Revenue Per Visitor: The Formula and a Real Benchmark
Revenue per visitor is the only benchmark on a product page that cannot lie to you. It is total revenue divided by total visitors, and it is the number we guarantee for every page we rebuild.
The revenue per visitor formula, and why it beats a conversion rate benchmark
Revenue per visitor is simple: divide the revenue a page generated by the number of visitors it received. That single number already contains conversion rate and average order value at once, which is exactly why it is the metric worth benchmarking against, not either of those two alone.
A conversion rate benchmark is easy to fake. Push a cheaper product forward, run a discount, and conversion rate climbs while the business earns less per order. Revenue per visitor cannot be gamed that way, because the discount lands directly in the revenue side of the equation. A page that lifts conversion rate and drops revenue per visitor has lost, full stop, even if the conversion rate chart looks great in a report.
This is why our guarantee is written on revenue per visitor and nothing else: a 10% lift in revenue per visitor in a controlled test, or your money back, up to five test iterations. Read how that guarantee actually works on /guarantee/.
What decides the size of the number, before anyone writes a word
Most benchmarks stop at the formula and jump straight to tactics. The bigger question is what actually decides how large the number gets, and the order matters more than any single tactic.
- What the visitor lands on. An ad for one product landing on a home page or a broad collection makes the visitor do the work of finding what they came for. Most will not do that work.
- What kind of page it is. A product page describes a product. An offer page argues for buying it right now. Those are different jobs, and they convert at different rates.
- How the page itself is built. Real, and the level most brands stop at, but a smaller lever than the two above.
- Single element changes. Button colour, badge wording. At this scale, close to noise.
Get the first two right and the rest of the page has to work much less hard. Get them wrong and no amount of copy polish saves the number.
The offer architecture most pages get wrong
The biggest lever inside how a page is built is the offer itself, and it is where we see the most money left on the table.
A tiered choice with a decoy does more work than almost anything else on a consumable or subscription product: three options, in visual order, with the best value tier badged as such, the middle tier badged most popular, and a one time purchase shown small and unbadged. That one time option is not there to be chosen. It exists to make the other two look obviously smarter by comparison.
Beside every tier, show the price per serving or per day. Large numbers shrink the moment they are divided. Anchor with a genuine struck through price, never an invented one, and stack value rather than only discounting deeper, itemising what comes free and totalling it against the cost.
The page that wins is the one that argues for buying it now, not the one that only describes the product better.
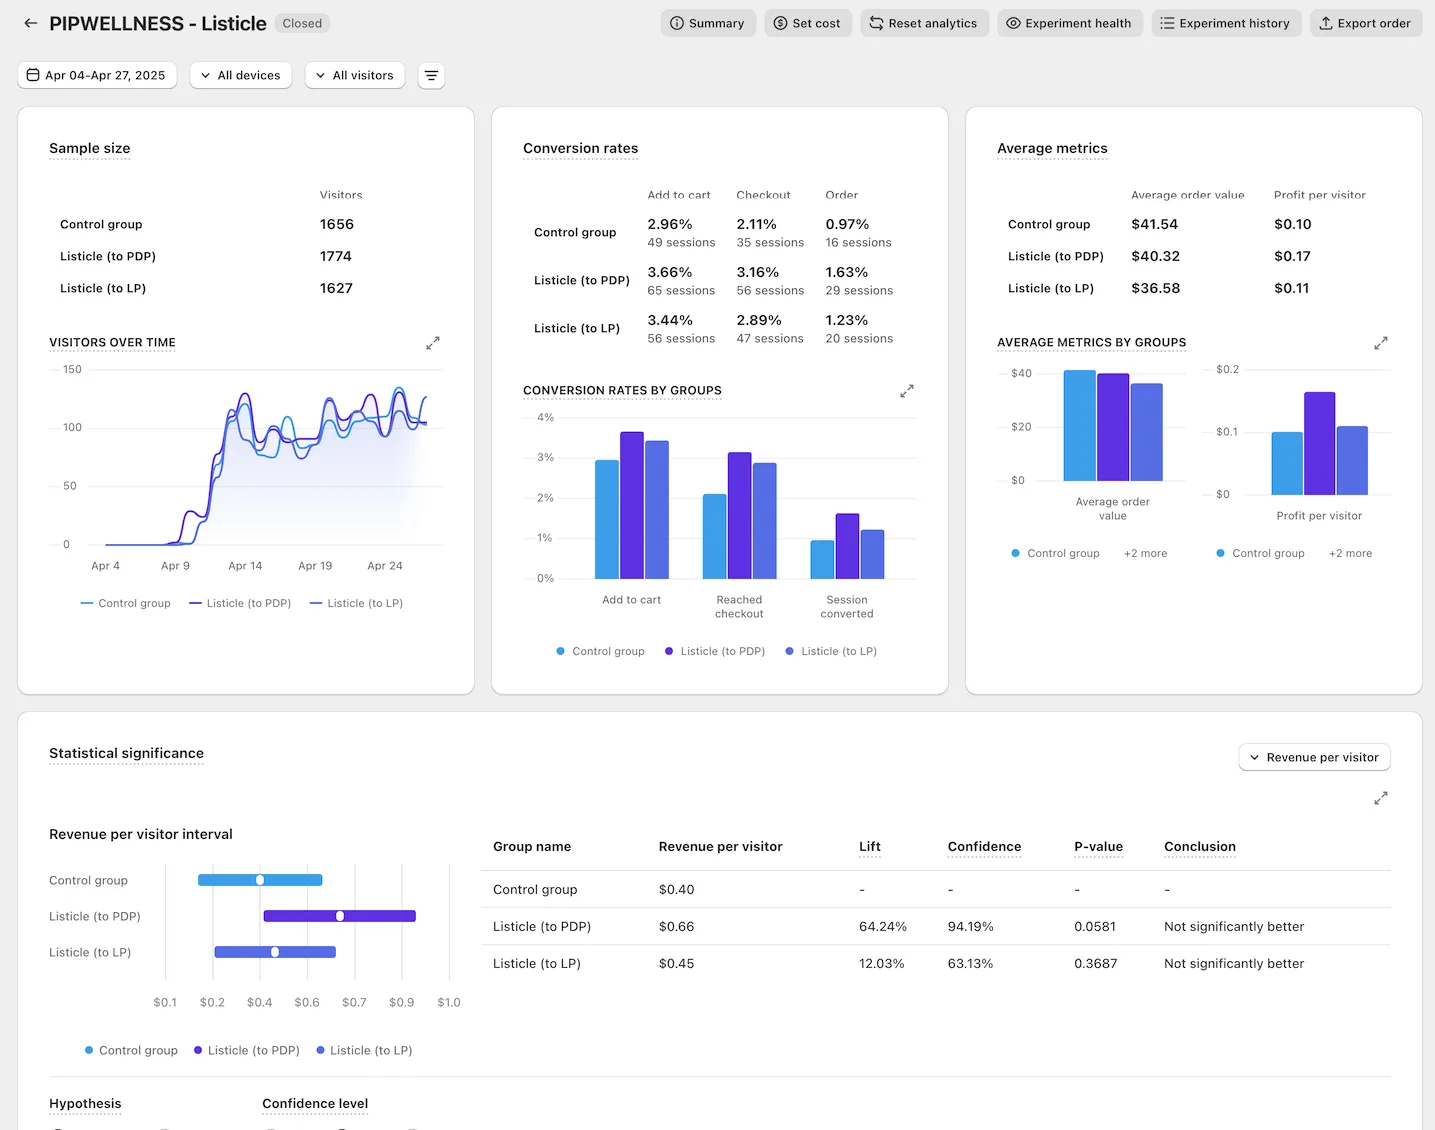
DuraDry ran an offer page against their own PDP on Google Ads traffic through VWO and posted +45% revenue per visitor over a two week test. PIP Wellness ran a listicle into their PDP against the control on Meta traffic through ABConvert and moved revenue per visitor from $0.40 to $0.66, a +64% lift.
What a real benchmark looks like, measured, not guessed
A believable benchmark for revenue per visitor is not a single average pulled from a survey. It is a set of controlled tests, each one a new page against the brand’s own current page, split on their own live traffic, read from the testing platform rather than an ad platform’s generous attribution.
Across the tests we have run and can show, the range is wide on purpose:
- Particle for Men, offer page vs their PDP, VWO, +21.4% across 12,893 visitors at 99.5% confidence, still live two years later.
- Sonic Brush, our PDP vs their PDP, Google Ads traffic, ABConvert, +24%.
- Bareline, our PDP template vs theirs, sitewide product traffic, Eraya, +13.5% at 99% probability to win across 92,484 sessions.
- Gum of Gods, our offer page vs their offer page, Meta traffic, ABConvert, +97%.
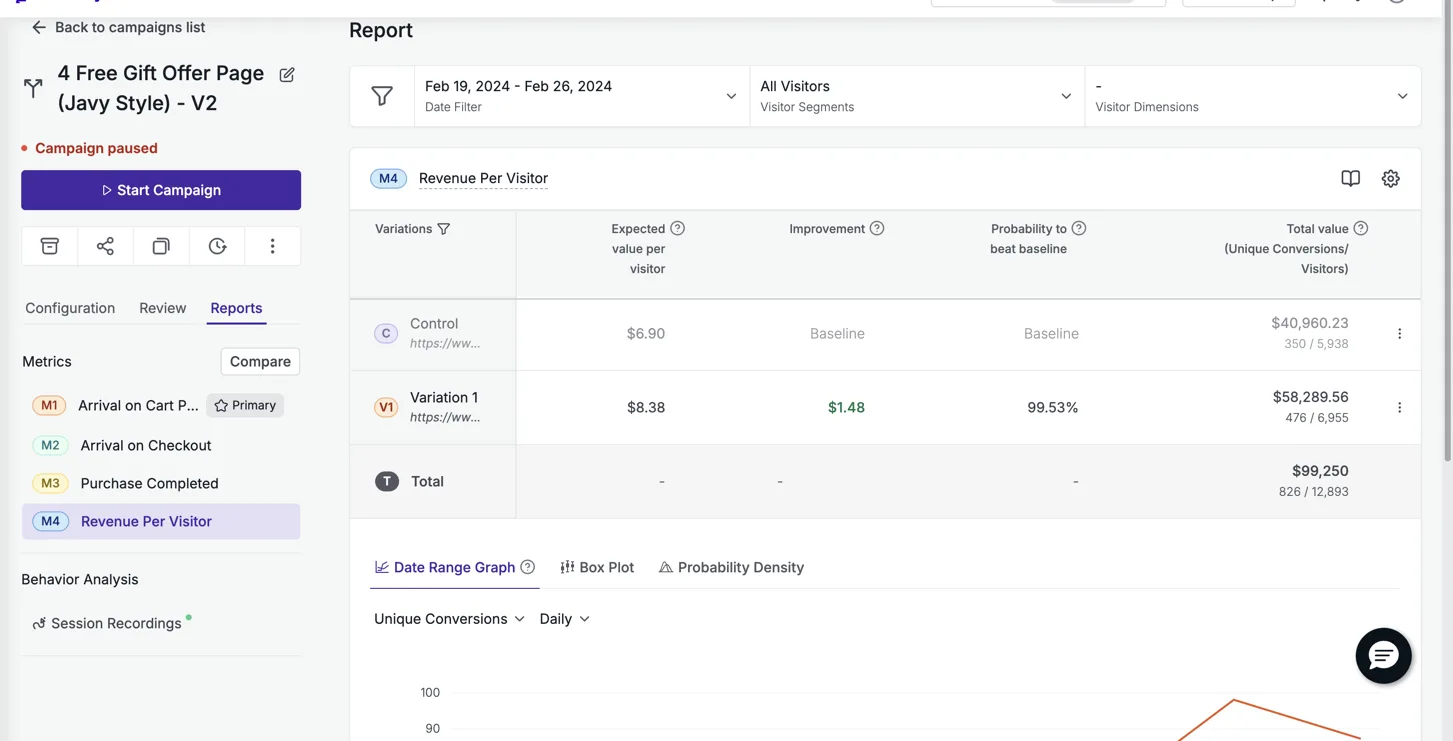
Those four sit inside a set of fifteen measured results, and the range across them is the honest benchmark: expect somewhere between a solid double digit lift and, on a smaller sample, a number that looks almost too good, like Prime Natural’s +307%, which we describe as a strong direction on a small sample rather than a settled result. You can look through the full set on /results/.
How to read your own number against this
If you already know your revenue per visitor and want to know whether it is good, the honest answer is that the number alone tells you very little. What tells you something is whether it moved after a controlled change, on your own traffic, read from a testing tool rather than guessed.
A winner that runs at full traffic for a long time will usually read lower later than it did during its controlled test. That is decay, not a lie about the original result, and it is exactly why the number worth trusting is the one attached to its methodology, not the one floating alone in a benchmark chart.
Stop asking what a good revenue per visitor number is. Ask what your page did the last time you changed it under real, measured conditions. That is the only benchmark that tells you anything about your business specifically.
See it on your own page.
We rebuild your highest-leverage page and prove the lift on your own live traffic. A 10% lift in conversion rate, or your money back.
Book a call