
How to Measure CRO Results Without Guessing
Most brands measuring CRO results are measuring the wrong number, on the wrong traffic, against a control that was never actually controlled. If you want to know how to measure cro results and trust what the dashboard tells you, the method has to come before the number.
How to measure cro results without fooling yourself
The test only means something if three things are true at once. The new page ran against the brand’s own current page, not a guess at what it used to convert at. It ran on the brand’s own live traffic, split by the testing platform, not projected from a sample somewhere else. And it was read from the testing tool, not from what an ad platform reported. Ad platforms attribute generously and cannot see what the page itself did. Every one of our 15 measured case results was read the same way: our page against the brand’s page, on their traffic, from the platform. Nothing here is ad platform reported revenue.
Revenue per visitor is the only number that resists gaming
Conversion rate feels like the obvious thing to watch, and it is the easiest one to move without actually helping the business. Push a cheaper product forward, run a coupon, and conversion rate climbs while the order value falls. The page wins the metric and the brand earns less per visitor.
Revenue per visitor is total revenue divided by total visitors, so conversion rate and average order value are both baked into one number. A discount cannot flatter it, because the discount lands inside the revenue too.
A page that lifts conversion rate and drops revenue per visitor has lost, no matter what the conversion number says.
This is the number behind our guarantee: a controlled test has to show at least a 10% lift in revenue per visitor or the rebuild is refunded, across up to 5 test iterations. Read more on /guarantee.
The leverage order, and why most of the win happens before the test starts
The size of a result is mostly decided before anyone writes a headline. In order of how much they actually move revenue per visitor:
- What the visitor lands on. An ad for one product sending traffic to a home page or a broad collection makes the visitor hunt for what they clicked for. Most will not bother.
- What kind of page it is. A product page describes a product. An offer page argues for buying it now. Different jobs, different conversion behavior.
- How the page is built. Real, and where most brands start, but smaller than the two above.
- Single element changes. Button color, badge wording. Close to noise at this scale.
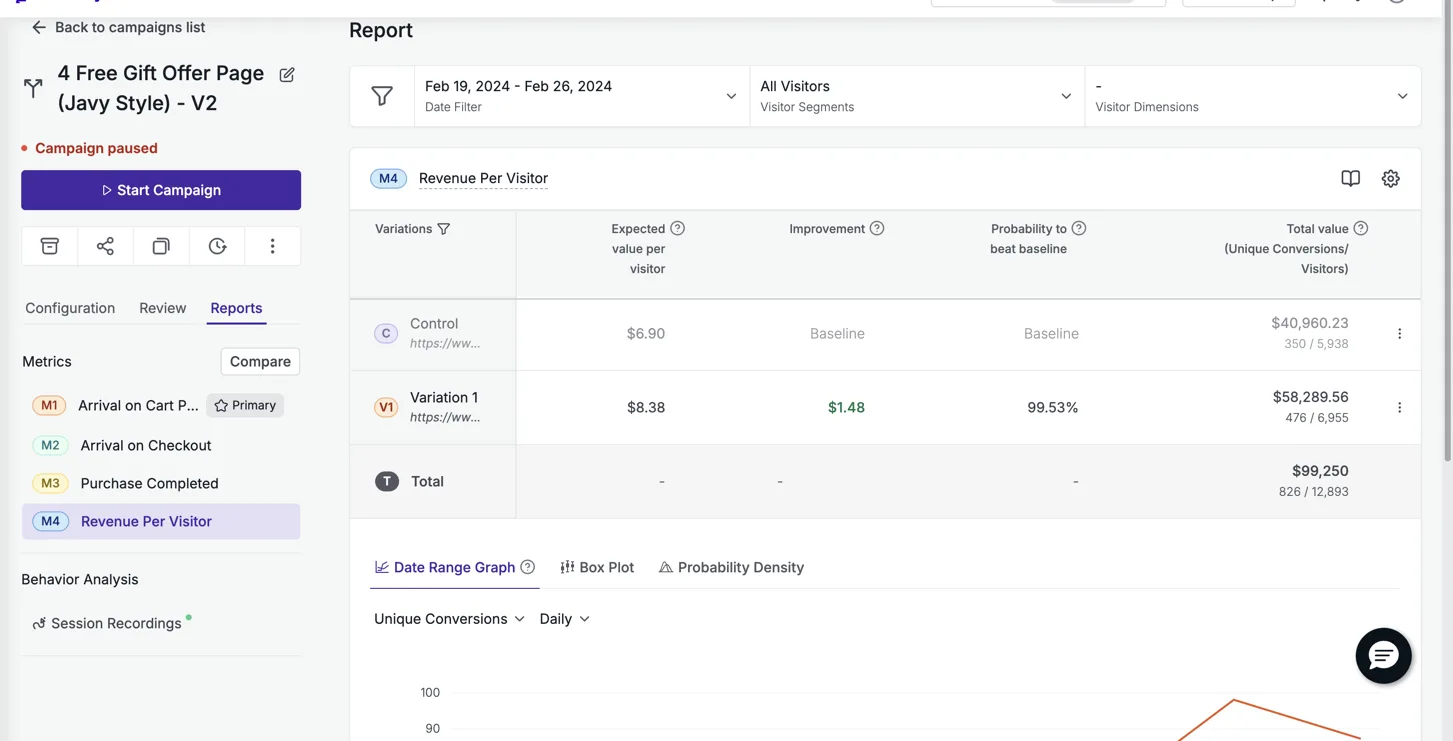
That ordering shows up directly in the results. Particle for Men ran an offer page against their own PDP and landed +21.4% revenue per visitor at 99.5% confidence across 12,893 visitors, a test still live two years later. Eiyan Lens tested an offer page against a home page on Google Ads traffic and came back +52%.
What the offer itself has to do, not just the layout
A rebuilt page earns its lift from specific mechanics, not from looking nicer. Price the tiers with unit economics next to each of them, since a large number shrinks the moment it is shown per serving or per day. Anchor a discount against a genuine price, never an invented one. Stack value instead of only cutting price further: itemize what is included free, total it, and let that total argue against the discount on its own. Then repeat the guarantee, shipping, and cancellation terms under every buy button, because trust has to be visible at the exact moment someone is deciding.
Proof follows the same discipline. Catalogue what the brand genuinely has and place the strongest piece of it above the fold. DuraDry ran an offer page against their PDP on Google Ads traffic for two weeks and returned +45%. Free the Roots tested an offer page against a collection page on Meta traffic and came back +33%. Neither result came from adding proof that was not there. It came from putting the real proof where the visitor sees it first.
Read significance, not just the headline number
Two of our results, Prime Natural at +307% and Snuff Cup at +310%, are real numbers from real controlled tests, and they ran on small samples. That makes them a strong direction, not a settled result the way Bareline’s +13.5% is, which held up at 99% probability to win across 92,484 sessions. Report both honestly and say which is which.
The other trap sits on the far end of the timeline. A page that wins its controlled test and then runs at full traffic for a long stretch will usually read lower later than it did on day one. That is decay, not a lie about the original result. It is exactly why the honest number to publish is the one from the controlled test, with its methodology attached, not whatever the dashboard shows a year on.
That is the whole discipline: control the test, measure revenue per visitor, know the leverage that actually produced the number, and say which results are settled and which are still a direction. See the full set of results at /results.
See it on your own page.
We rebuild your highest-leverage page and prove the lift on your own live traffic. A 10% lift in conversion rate, or your money back.
Book a call