
How to A/B Test a Shopify Product Page
Most guides on how to a/b test a Shopify product page start in the wrong place. They open with button colors and traffic splits, as if the page structure were already correct and only the paint needed testing. We have run fifteen measured revenue per visitor tests across brands we have worked with, and the biggest wins never came from a color. They came from testing the right lever first, not last.
How to A/B Test a Shopify Product Page, Starting With the Right Lever
Before you touch a single element on the page, decide what you are actually testing against. There is an order to this, and it is not optional.
- Where the visitor lands. An ad for one product sending traffic to a home page or a broad collection makes the shopper do the work of finding what they clicked for. Most will not bother.
- What kind of page it is. A product page describes a product. An offer page argues for buying it now. These are different jobs, and they convert differently.
- How the page itself is built. Real, and where most brands start, but a smaller lever than the two above.
- Single element changes. Button color, badge wording. At this scale it is closer to noise than signal.
Test in that order or you will spend three weeks proving a headline font does nothing, while the actual leak, a mismatched landing destination, keeps draining the traffic you paid for.
Test the Offer, Not Just the Layout
The single biggest structural change we make, and the one most product pages skip, is testing an offer page against the product page itself, rather than a redesigned version of the same product page.
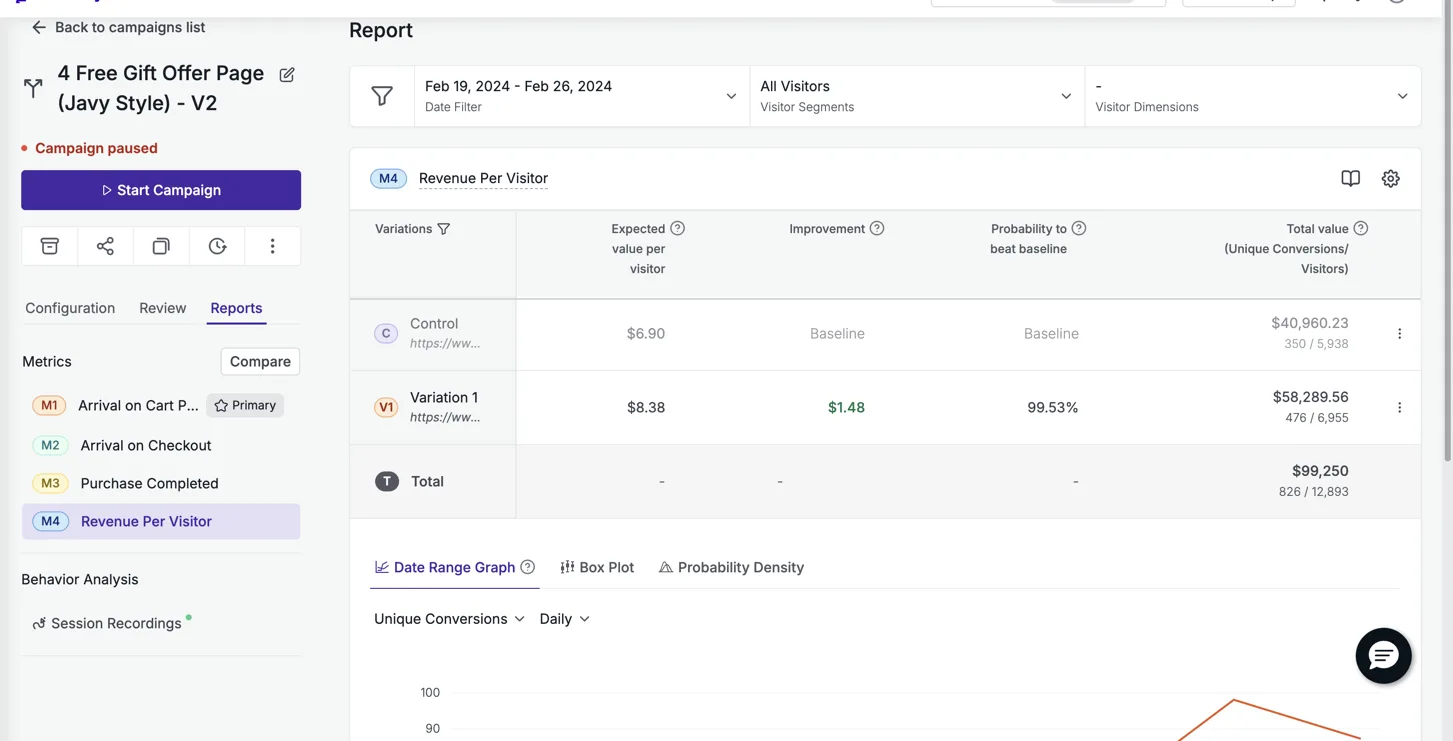
Particle for Men ran their offer page against their existing product page in VWO, and it won by 21.4% in revenue per visitor at 99.5% confidence across 12,893 visitors. That page is still live two years later, which tells you something a single test cannot. A real structural win does not need to be refreshed every quarter to keep working.
An offer page is not a prettier product page. It stacks the reasons to buy now: a tiered choice with a decoy option, unit economics next to every price, a genuine struck through anchor price, and the trust cluster repeated under every buy button. A product page describes. An offer page closes. Test that difference before you test anything smaller.
Optimize for Revenue Per Visitor, Not Conversion Rate
If your Shopify A/B test only tracks conversion rate, you can win the test and lose the business. Revenue per visitor is conversion rate and average order value multiplied into one number, and it cannot be gamed by a discount, because the discount shows up inside the revenue itself.
A coupon or a cheaper product pushed to the front will lift conversion rate on its own. It will often drop revenue per visitor at the same time. That is a losing test dressed as a winning one.
Read revenue per visitor, not conversion rate. A test that lifts clicks and drops revenue has already lost, it just has not told you yet.
Every number we publish on /results is measured this way: the new page against the brand’s current page, split on their own live traffic, read straight from the testing platform. Never revenue reported by the ad platform, which attributes generously and cannot see what the page itself did.
Read the Significance, Not the Headline
A large lift on a small sample is a direction, not a result. Bareline tested our product page template against their own product page template across 92,484 sessions, sitewide, in Eraya, and won by 13.5% in revenue per visitor at 99% probability to win. That is a real result because the sample earned it.
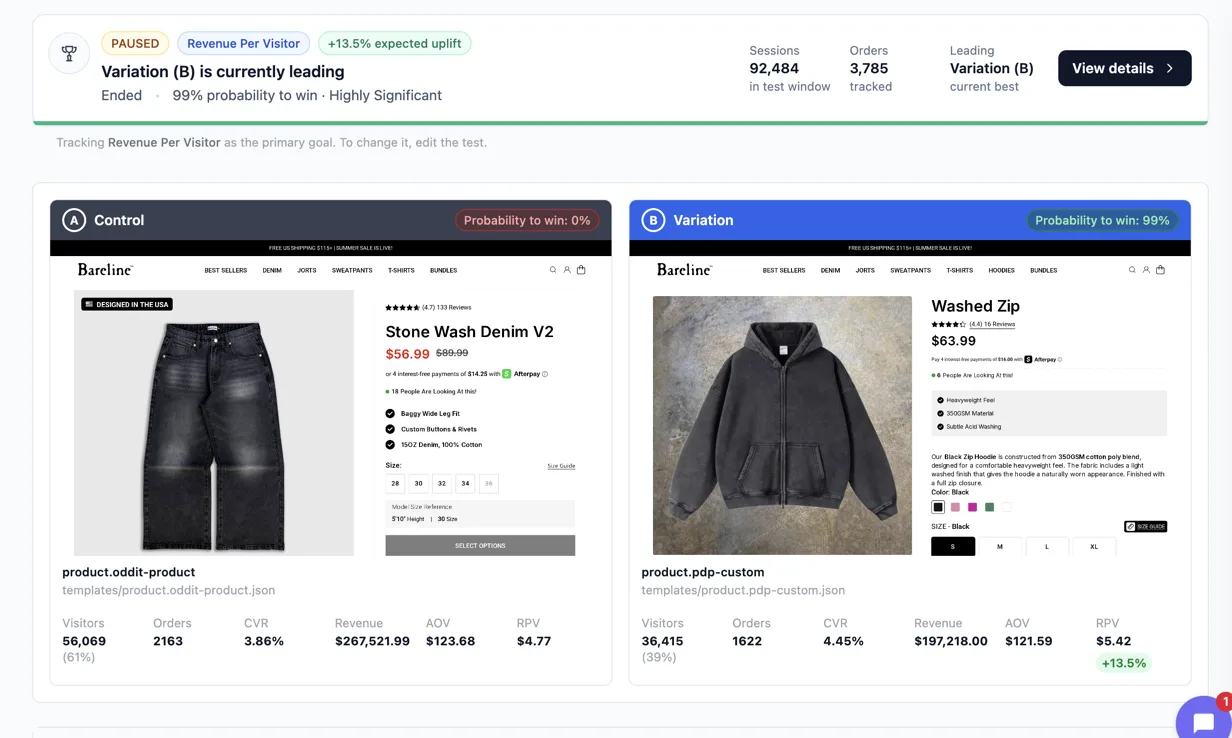
A 13.5% lift at that sample size is worth more than a large lift on a few hundred visitors, even though the large number looks better on a slide. Some of our own results, like Prime Natural at 307%, are small sample directional wins, and we say so plainly.
One more thing worth knowing before you launch a test: a winner that runs at full traffic for a long time will usually read lower months later than it did in its controlled test window. That is decay, not a lie about the original result. It is why the honest number to publish is the controlled test result with its methodology attached, not whatever the dashboard says today.
What This Looks Like End to End
Running this properly means deciding, in order, whether the traffic is landing on the right page, whether that page is arguing an offer or just describing a product, and only then tuning the page itself. Skip the first two and no amount of button testing will find the win that was sitting in front of you.
If you want the mechanics we use to build the page itself, before it ever goes into a test, that is what /guarantee walks through, along with the terms of the test itself: 10% or your money back, across up to five iterations, measured the same way every result above was measured.
See it on your own page.
We rebuild your highest-leverage page and prove the lift on your own live traffic. A 10% lift in conversion rate, or your money back.
Book a call