CRO: Subscription vs One Time Purchase Products
Conversion rate optimization subscription vs one time purchase products is not the same exercise wearing two names. A consumable that gets reordered every month and a jacket someone buys once are won by different parts of the page, and treating them the same is why so many rebuilds lift one and barely move the other.
A one time purchase product has one job: convince the visitor this specific item, at this specific price, is worth buying right now. A consumable or subscription product has a second job stacked on top of the first: convince the visitor which plan to pick, and make the ongoing cost feel small. Build the same page for both and you will undersell one of them.
What actually drives conversion rate optimization subscription vs one time purchase products
On a subscription or consumable product, the tiered offer table is the highest leverage element on the page, full stop. Three options, laid out in a specific visual order: the best value tier badged as such, a middle tier badged most popular, and a one time purchase option shown small and unbadged on purpose. That third option is not there to be chosen. It exists to make the other two look like the obvious smarter pick.
Unit economics matter here in a way they do not on a one time item. Price per serving or price per day beside every tier turns a number like a monthly total into something trivial. A large number divided into a small one almost always shrinks.
On a one time purchase product none of that applies, because there is no plan to choose between. What wins instead is a cost replacement anchor: itemize what the buyer would otherwise pay to get the same result some other way, total it, then show your price against that total. On the right product this single block is the highest leverage thing on the page, and it works precisely because there is no subscription math competing for the reader’s attention.
The measured results back the split
Dreem Nutrition, a wellness gummy brand, is a subscription and consumable product by nature, and its offer page beat its product page by 19% in revenue per visitor on VWO with full metric tracking. Gum of Gods, a functional gum brand, is the same shape of product, and our offer page against their own offer page produced the largest lift in this whole set, 97% in revenue per visitor on ABConvert over Meta traffic.
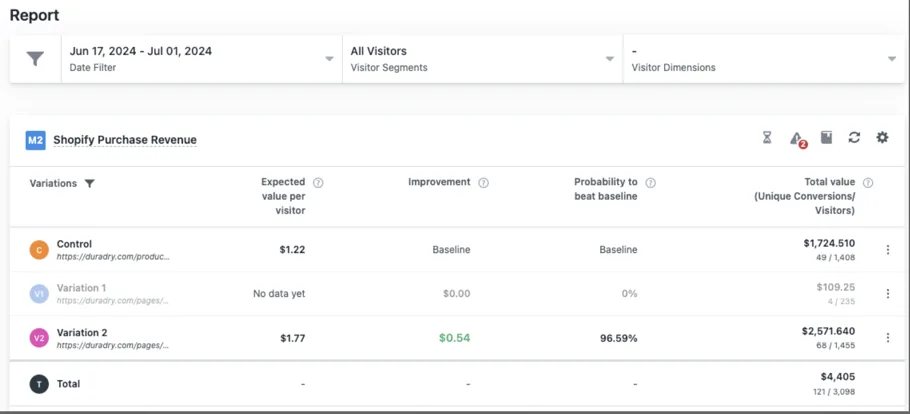
DuraDry sits closer to the middle, a sweat care product that is bought on a reorder cycle without being framed as a classic subscription box, and its offer page beat its product page by 45% in revenue per visitor on Google Ads traffic. Particle for Men, a men’s skincare product with a clear replenishment cadence, is still running the same winning page two years after the original test, which in itself tells you something: offer pages built around unit economics and a tiered table do not decay the way a single bold claim does, because the math underneath them stays true.
The offer table does the convincing on a consumable. The price tag does the convincing on a one time purchase.
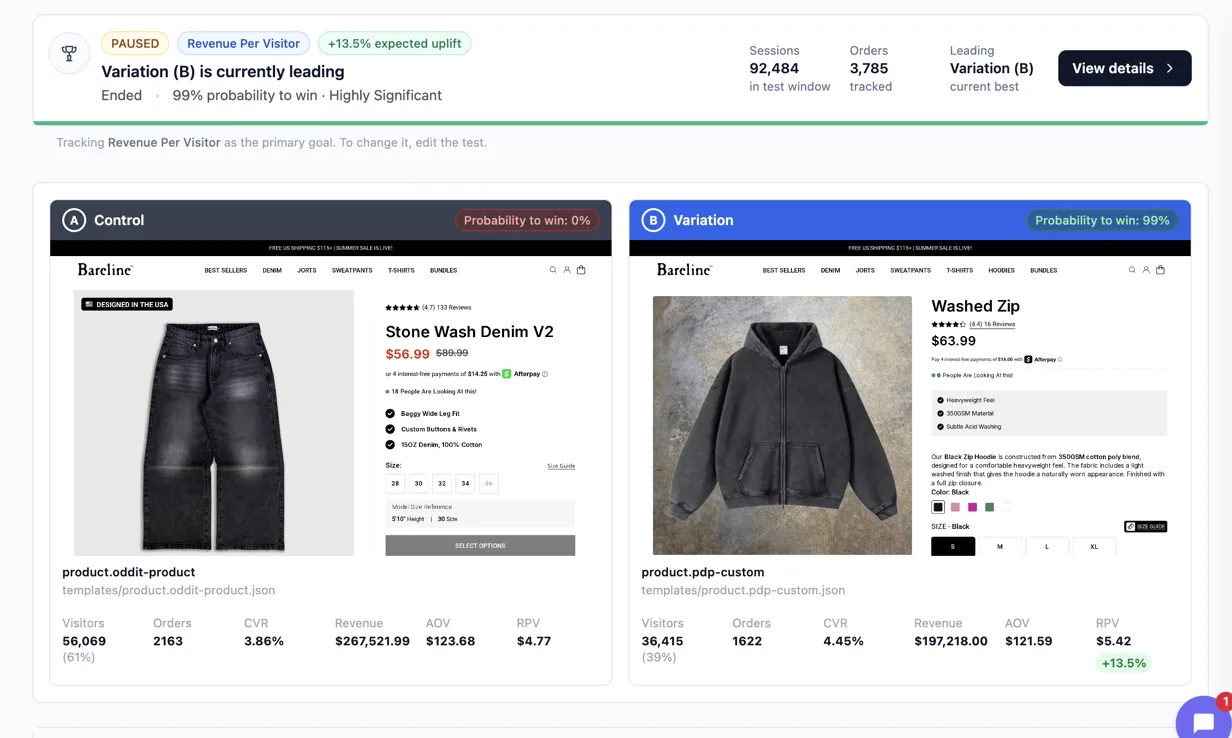
Now look at the one time purchase side. Bareline, a streetwear denim brand, had no subscription question to answer at all, and our product page template against theirs still produced a 13.5% lift in revenue per visitor at 99% probability to win across 92,484 sessions, the largest sample in this entire list. That lift did not come from a smarter pricing tier. It came from page structure, proof placement, and a clearer reason to buy the item in front of them right now.
Legendary Car Care, an automotive product bought as needed rather than on a subscription, posted a 32% lift in revenue per visitor on an offer page against its product page over Meta traffic, again without a tiered pricing table doing the work. Billy Bones Club, a streetwear brand, measured a 10.5% lift in conversion rate directly (their team iterated alongside ours, so read that one as directional rather than a clean controlled number), and the lever there was page structure and proof, not plan selection.
Proof still has to match the product, not the category
Category decides which lever carries the most weight, but it never decides what proof you are allowed to show. Catalogue what the brand genuinely has before writing a line of copy. A founder story, a real clinical result, verified reviews, an ambassador roster. Whatever exists gets used, in roughly the order of how much weight it carries, and whatever does not exist gets left out rather than invented. A subscription brand with no clinical backing should not pretend to have one just because its competitors do, and a one time purchase brand with ten years of five star reviews should not bury them below the fold because a template said proof goes at the bottom.
This is also where most AI generated rebuilds give themselves away. A page built from a template puts the same bordered card around every section, subscription or not, so a one time purchase page gets a pricing table it does not need and a consumable page gets a static buy box that hides its own unit economics. The fix is not cosmetic. It is building the page around which lever the product actually needs, then letting design follow.
PIP Wellness, an intimate wellness brand, is a useful case for how far a small sample can swing: a listicle style page against their product page produced a 64% lift in revenue per visitor, moving revenue per visitor from $0.40 to $0.66. That is a real number from a real test, and it is also exactly the kind of result that needs a controlled read rather than a glance at a dashboard, which is the whole reason every figure on this page is read from the A/B testing platform and never from ad platform reported revenue. You can see the methodology behind every number we publish on /results/, and the guarantee that backs this whole approach, a 10% lift in conversion rate or your money back, is explained in full on /guarantee/.
See it on your own page.
We rebuild your highest-leverage page and prove the lift on your own live traffic. A 10% lift in conversion rate, or your money back.
Book a call