Conversion Rate Optimization By Ecommerce Niche
We have rebuilt pages for a men's skincare brand, a streetwear denim label, an automotive care company, and a nasal snuff accessory. Four categories that share nothing except a Shopify checkout. And the lifts were not close to random: double digit gains showed up in skincare, denim, automotive, hair care, oral care, wellness, eyewear, food, pet grooming, and more. If conversion rate optimization by ecommerce niche actually depended on the niche, that spread should not exist.
It does not depend on the niche. It depends on what the page is built to do.
The spread across categories is the whole argument
Look at what we have actually measured, in order of how unrelated the categories are:
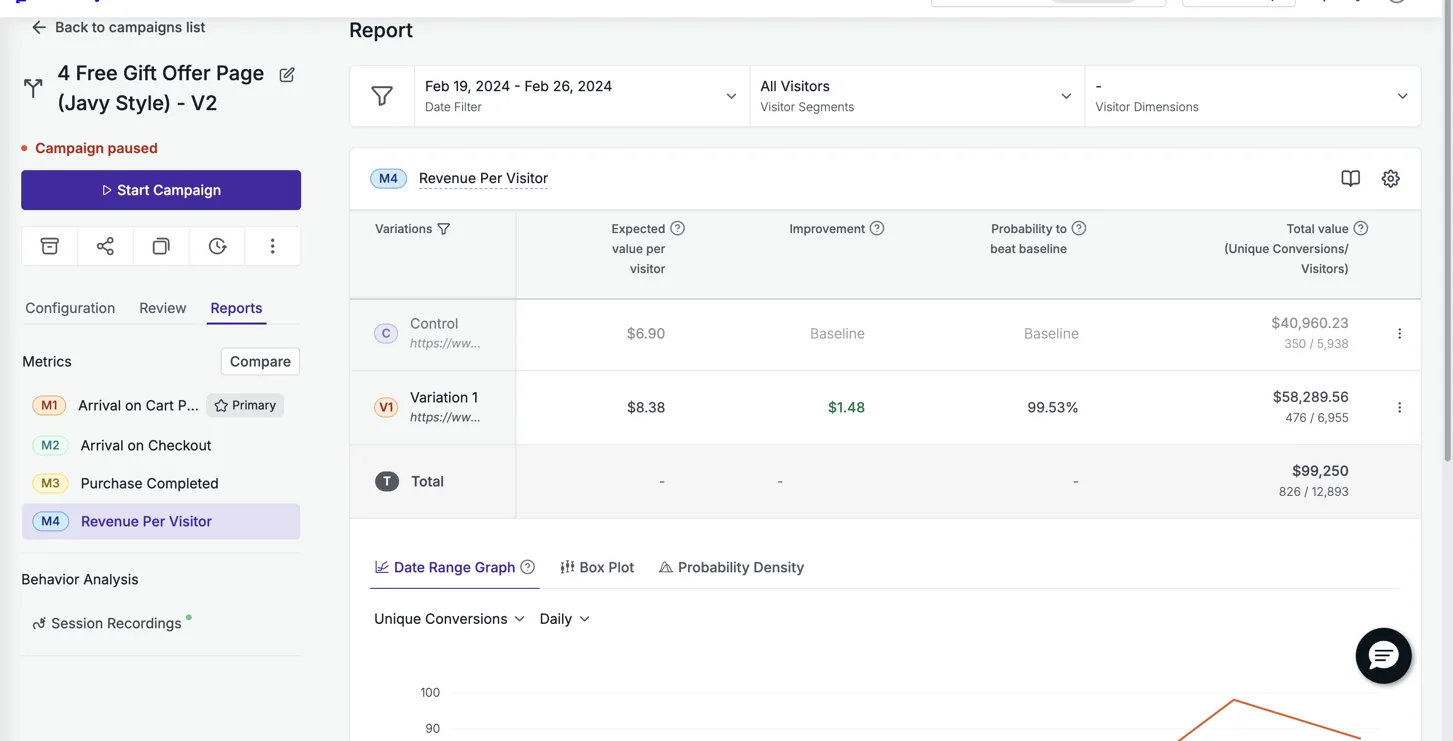
- Particle for Men (men’s skincare): revenue per visitor +21.4%, 99.5% confidence across 12,893 visitors, still live two years later.
- Legendary Car Care (automotive): revenue per visitor +32%.
- Free the Roots (natural hair care): revenue per visitor +33%.
- Sonic Brush (oral care): revenue per visitor +24%.
- Pure Path Shop (pet grooming): revenue per visitor +10%.
- Bareline (streetwear denim): revenue per visitor +13.5%, 99% probability to win across 92,484 sessions.
Six categories, six positive results, and not one of them shares a supply chain, a customer age bracket, or a price point with another. A skincare routine and a pair of jeans do not sell the same way to the same person. But the page structure that lifted one lifted the other.
This is not a coincidence we are reading into the data. It is the point of testing conversion rate optimization by ecommerce niche this way: hold the method constant, change the product, and watch whether the lift survives the swap.
What actually moves before the page design does
Most store owners think a conversion rate problem is a page design problem. Sometimes it is. But page design is the third lever we pull, not the first.
The first lever is what the visitor lands on. An ad for one specific product that lands on a home page or a broad collection makes the visitor do the finding work themselves. Most will not bother. The second lever is what kind of page they land on. A product page describes a product. An offer page argues for buying it right now. Those are different jobs, and they convert at different rates even with identical photography and copy.
Only after those two are right does page construction become the lever worth pulling. That is why an offer page beat a product page in skincare, automotive, hair care, food, and wellness, and why a rebuilt product page template beat the original product page template in denim and pet grooming. The category did not decide which approach won. The traffic source and the page type did.
The decoy and the unit price, regardless of what is in the box
Here is something concrete you can use tomorrow, on any product.
When a page offers more than one quantity or plan, structure it as three options in a specific visual order: the best value tier badged as such, a middle tier badged most popular, and a plain one time purchase shown small and unbadged. The one time option is not there to be bought. It exists to make the other two look like the obvious smarter choice by comparison.
Next to every tier, show the price per unit, per serving, or per day. A large total price shrinks the moment it is divided. This works whether the product is a tube of serum or a jar of gummies, because the psychology is about how the number is framed, not what the number buys.
We have never seen a result in automotive, skincare, food, or wellness that came from changing what the product is. Every lift we can point to came from changing how the choice was framed, not from changing the thing being chosen.
Proof works the same way regardless of category
The other lever that does not care about niche: what proof you show, and where you put it.
Catalogue what a brand genuinely has, then rank it. Roughly, from strongest to weakest: a credible founder story, a real ambassador roster, a scientific or clinical association if one truly exists, third party certification, then volume and review proof. The strongest thing a brand actually has goes above the fold. Deeper proof earns the middle of the page. A brand with thin proof should get a shorter page, not a padded one.
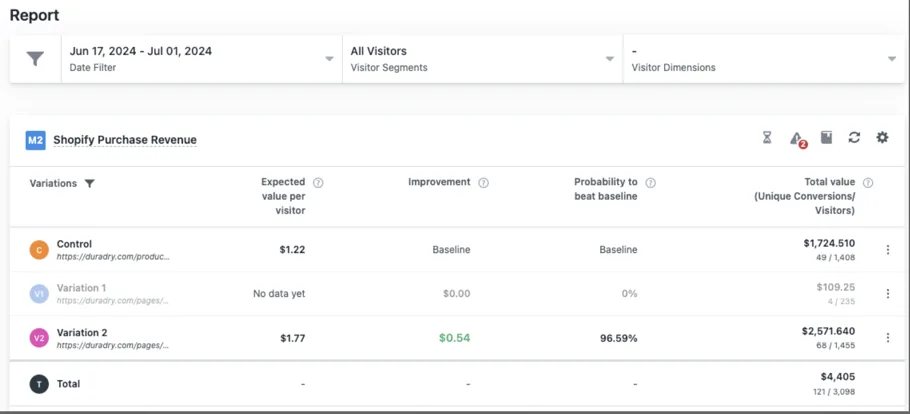
This is where a lot of rebuilds go wrong without the category mattering at all. DuraDry, a sweat care brand, posted a +45% revenue per visitor lift running an offer page against their product page over two weeks. Dreem Nutrition, a wellness gummy brand, posted +19%. Different proof available, different category, same underlying move: putting the brand’s strongest, truest claim where a cold visitor sees it first instead of three scrolls down.
The outliers prove the rule, not the exception
Two results sit well above the rest: Prime Natural, essential oils, +307%, and Snuff Cup, a nasal snuff accessory, +310%. Both came from small samples, and we say that plainly rather than letting the number stand alone. A huge lift on a small sample is a direction, not a settled result.
But notice what these two have in common besides the size of the number. Essential oils and snuff accessories are about as far apart as two product categories can get, and both responded to the same move: an offer page replacing a bare product page. The size of the win is not proof the category is special. It is more evidence the category was never the variable that mattered.
What this means for your store
If your conversion rate is flat and you are telling yourself your niche is just hard to sell in, that is worth testing rather than assuming. We have run this exact comparison, offer page against product page or rebuilt template against original template, across men’s skincare, denim, automotive, oral care, hair care, wellness, eyewear, food, and pet grooming. The method held up in every one. See the full list of measured results on our results page, including the cases we did not cite here.
The guarantee behind this is simple: a 10% lift in conversion rate in a controlled test, or your money back. Full terms are on the guarantee page.
See it on your own page.
We rebuild your highest-leverage page and prove the lift on your own live traffic. A 10% lift in conversion rate, or your money back.
Book a call