
AB Test Winner Conversion Rate Dropped: Why
You ran the test, you won, you shipped the winner, and six months later the dashboard reads a fraction of what the test promised. This is the single most common message we get from a founder who ran their own A/B test: ab test winner conversion rate dropped over time, did we get lied to, was the original number fake. The number was not fake. What you are looking at is decay, and it happens to almost every winning page that goes on to run at full traffic for a long time.
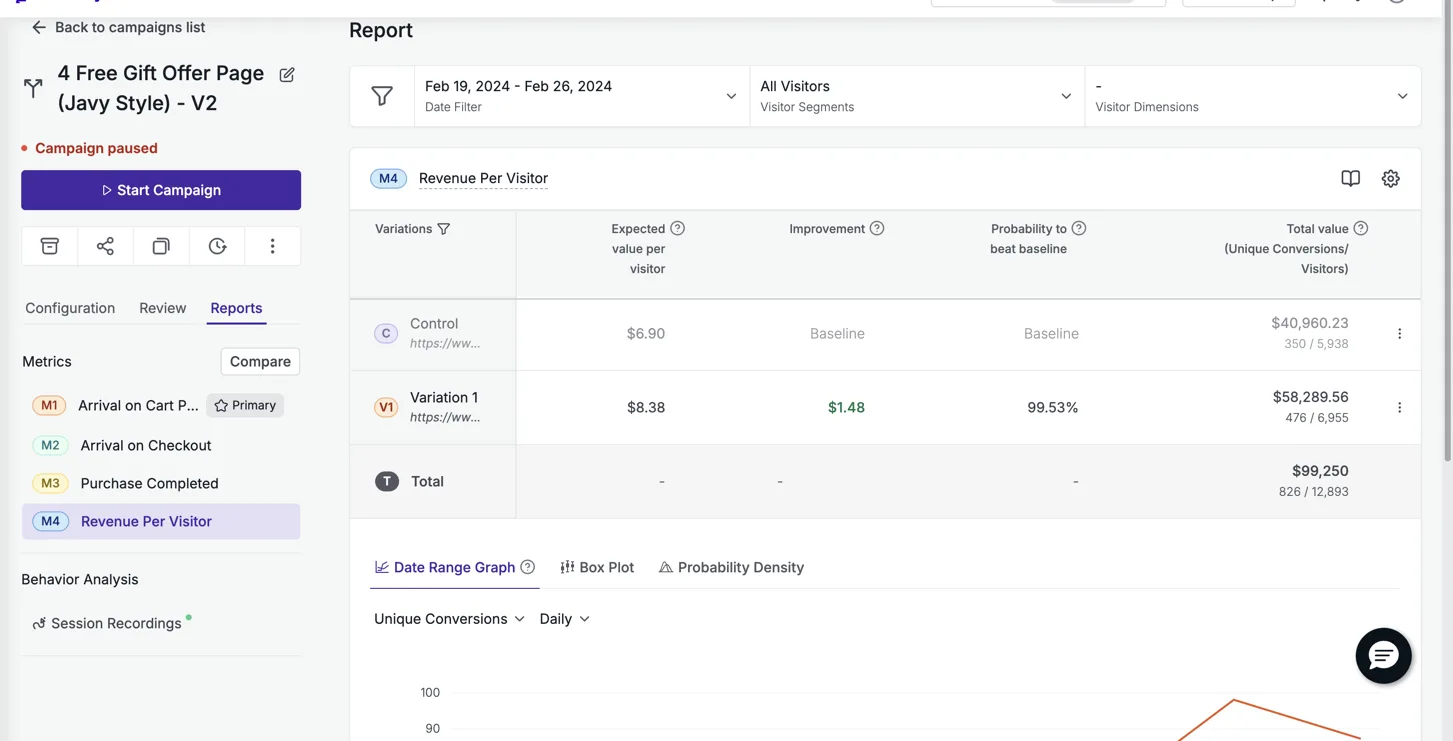
Here is the mechanism, in plain terms. A controlled test splits your live traffic between two pages over a fixed window, and it reads the result off the testing platform, never off ad platform reported revenue. That number describes exactly what happened during that window, with that traffic, at that moment. It is not a promise about every future month. Traffic mix shifts, ad creative changes, competitors move, the novelty of a new page wears off on repeat visitors. None of that erases the original result. It just means a live page measured in month eight is answering a different question than a controlled test measured in week two.
Why the controlled test number is still the one to trust
The honest way to report a result is the controlled number with its methodology attached, not whatever the live dashboard says today. Methodology means: which page against which page, what traffic, what platform, how many sessions, what confidence.
A controlled test isolates one variable and reads the result on your own traffic. A live page absorbs everything else that happens in your business afterward.
Take Bareline, a streetwear denim brand. Their rebuilt product page beat their existing template at +13.5% revenue per visitor, at 99% probability to win across 92,484 sessions. That is not a hunch, it is a result with enough volume behind it to trust. If you checked that page’s live performance today against a Tuesday two years from now, you would be measuring seasonality and ad spend, not the page.
Or Particle for Men, whose offer page beat their product page at +21.4% revenue per visitor, 99.5% confidence across 12,893 visitors, on VWO. That page is still live two years later. The controlled number from the original test is the number we quote, because it is the one that isolated the page as the variable.
What actually causes a winner to read lower later
A few forces are always at work once a page goes from a 50/50 split to 100% of traffic:
- Traffic mix changes. The audience during a two week test is rarely the same audience six months later. New campaigns, new platforms, colder lists all shift who lands on the page.
- Novelty fades. A new page structure can convert better simply because it is new to repeat visitors and to your own ad creative testing. That lift is real during the test and it thins out over time.
- The rest of the funnel drifts. Ad copy, pricing, shipping times, even your email flow all change independently of the page, and revenue per visitor reflects all of it, not just the page.
- Seasonality. A test that ran in a strong sales month will not repeat that baseline in a slow one, regardless of the page.
None of this is a defect in the test. It is exactly why we read significance, not just direction, at the time of the test, and why a large lift on a small sample gets described as a direction rather than a result. Prime Natural posted a +307% lift on a small sample, which we report as exactly that, a strong early direction worth acting on and not a promise that a live page will run 4 times better forever.
The metric that makes this less confusing
Part of why this trips people up is that they are watching conversion rate, which is easy to move and easy to misread. We optimize for revenue per visitor instead, because it contains both conversion rate and average order value in the same number and cannot be gamed by a discount. A page that lifts conversion rate while quietly lowering the size of the average order has not actually won. Every result we publish, from Eiyan Lens at +52% to DuraDry at +45%, is read the same way: the new page against the brand’s current page, split on their own live traffic, off the testing platform.
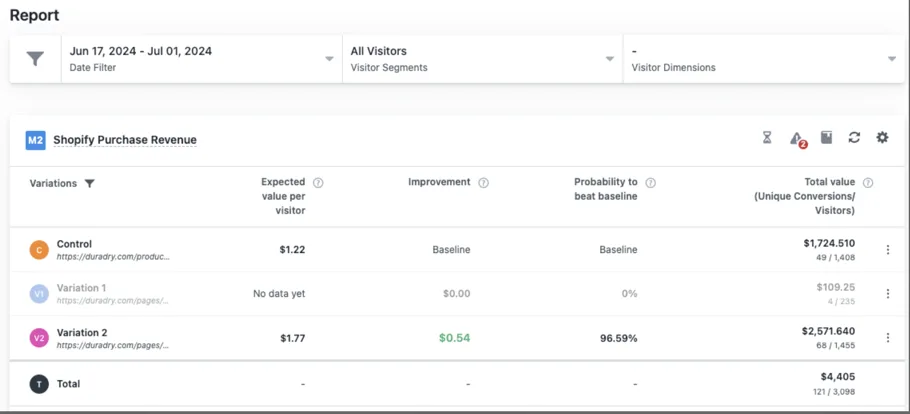
That consistency is also why we never carry one brand’s number onto another brand’s page, and why a page’s proof section only ever states what that specific brand can back up. A borrowed number is the first thing a founder spots, and it undermines every real number sitting next to it.
What this means for how you should read your own dashboard
If your live conversion rate today looks worse than the test that got you there, the test almost certainly was not wrong. Check three things before you touch the page again: has your traffic source changed, has your offer or pricing changed since the test, and how long has the winner been running at full volume. A page that has been live for a year against a two week test is not a fair comparison, it is two different questions.
The practical move is to retest periodically rather than trust a live number indefinitely. A page is not a fixed asset, it decays the way any single variable does once everything around it keeps moving. That is the whole logic behind our guarantee: a 10% lift in revenue per visitor in a controlled test, or your money back, across up to five test iterations, because the controlled read is the only one either of us can stand behind. You can see the full guarantee terms on the guarantee page, and every measured result behind these numbers, screenshots included, sits on the results page.
See it on your own page.
We rebuild your highest-leverage page and prove the lift on your own live traffic. A 10% lift in conversion rate, or your money back.
Book a call